 PrOlor is the world's first commercial software application capable of forecasting odour impact two days in advance by using advanced dispersion models together with odour measurements taken at the sources.
In this study, the PrOlor tool was used for ten months to forecast the odour impact of an animal by-products processing plant on a municipality close to the plant.
Carlos Nietzsche Díaz Jiménez 1*, Cyntia Izquierdo Zamora 1, David Cartelle Fernández 2, Jose M. Vellón Graña 2, Ángel Rodríguez López 2
1. SVPA, Servicios de Protección Ambiental. carlosdiaz@svpa.es
2. Troposfera Soluciones Sostenibles S.L., C/ Real 217, 15401 Ferrol, A Coruña, Spain.
Conflicts of interest: The author declares that there is no conflict of interest.
Academic editor: Carlos N Díaz.
Content quality: This scientific article has been reviewed by at least two reviewers. See the scientific committee here
Citation: Carlos Nietzsche Díaz Jiménez, Cyntia Izquierdo Zamora, David Cartelle Fernández, Jose M. Vellón Graña and Ángel Rodríguez López, 2015, PrOlor, Forecasts Odour Two Days in Advance. Case Study at an Animal By-Products Processing Plant, III International Conference on Odour Management in the Environment, Bilbao, Spain, www.olores.org
Copyright: The authors retain copyright of their articles, but allow anyone to download, reuse, reprint, modify, distribute and/or copy articles from the olores.org website, provided that the original authors and sources are cited. No specific permission from the authors or the editors of this website is required.
ISBN: 978-84-608-2262-2.
Keywords: CALPUFF, PrOlor, WRF, odours, dynamic olfactometry, complaints.
Video (in Spanish)
Abstract
PrOlor is the world's first commercial software application capable of forecasting odour impact two days in advance by using advanced dispersion models together with odour measurements taken at the sources. This gives the operator of an industrial plant enough time to implement corrective measures and prevent the impact just before it occurs. In this study, the PrOlor tool was used for ten months to forecast the odour impact of an animal by-products processing plant on a municipality close to the plant. In addition, odour reports were collected throughout this period via a website accessible from mobile devices. The results show that PrOlor correctly forecasts 99.1% of all events.
1. Introduction
Traditionally, plants processing Animal By-Products Not Intended for Human Consumption (ABP), or rendering plants, have a high water vapour emission rate owing to the evaporation of water from the raw material during processing.
Along with the water vapour, a quantity of non-condensable gases originating from the raw material is released into the atmosphere; these gases usually have a low odour threshold.
Several towns are located in the vicinity of the plant, at distances of between 6 and 13 km from the facility. The prevailing wind direction is south-westerly, where there is a town with a long history of odour complaints. However, other municipalities in the area have also raised odour complaints.
Three years ago, in order to know when and where odours were perceived, and how intense they were, in real time, it was decided to install an online complaint registration system to send alerts to the plant and detect equipment malfunctions. Selected volunteers were given direct access to an online form on which they could record the odours they perceived.
The plant received 91 and 68 odour incidents in 2013 and 2014, respectively. Owing to this high number of incidents, the plant decided to install PrOlor, the world's first commercial odour impact forecasting software. The plant operator thus began to forecast, two days in advance, when an odour incident would occur. With this information, the plant began to schedule several shutdowns or to shift production to hours when no odour impact was expected.
PrOlor is an innovative, operational odour forecasting system. It enables the operating conditions of the odour-emitting source to be adjusted up to 72 hours in advance. The system can run in real time, assimilating emission data and running hourly in order to determine future odour concentrations. Finally, with the development of a smartphone interface, users can check their geographical location on their mobile phone and see the areas where the odour threshold is expected to be exceeded.
The aim of this study is to compare the forecast data with actual odour incidents and no-odour episodes for this ABP plant. In addition, the resolution of WRF was increased during the course of the study. The second aim of this study is therefore to assess the effect of the WRF improvement on the performance of PrOlor.
2. Methodology
PrOlor is based on the WRF/CALMET/CALPUFF modelling system, compiled and installed for Linux platforms (Cartelle et al., 2014).
The PrOlor system uses the Lagrangian air quality model CALPUFF (Scire et al., 2000b). The CALPUFF model has its own meteorological module, called CALMET, which processes meteorological data from surface and upper-air stations or from three-dimensional meteorological models.
To feed the CALMET model with meteorological data, the WRF mesoscale meteorological model is run beforehand. In PrOlor, the WRF model is run daily for a two-day forecast horizon, using a nested-domain configuration. Once the WRF process has finished, the CALMET 3D model is run, followed by the CALPUFF model.
PrOlor works with hourly averaging times; however, in order to reflect short-duration odour events to some extent, it applies a peak-to-mean ratio in accordance with the criteria established by the Environment Protection Authority of New South Wales, Australia (NSW, 2005).
In this case, the CALPUFF model considered odour emissions from 6 different sources. The odour emission rates for each source were obtained from several sampling and analysis campaigns using dynamic olfactometry.
The emission from each source was characterised by analysing samples in triplicate over several measurement campaigns. The sampling time for each bag was 30 minutes. As the processes were stable, the total sampling time for each triplicate at each source was one and a half hours. Temperature, flow rate and relative humidity were recorded at the same time.
After each sample was taken, the sampling line was purged with nitrogen to prevent cross-contamination. Where necessary, the sample was pre-diluted to prevent condensation. The two olfactometry laboratories that analysed the samples are accredited to EN ISO/IEC 17025 for the determination of odour concentration by dynamic olfactometry in accordance with EN 13725, and regularly take part in inter-laboratory comparison tests.
In February 2013, an incident register was set up through which volunteers from the municipality most affected by odour complaints began reporting odour incidents using a software application. This incident register remains open today.
Whenever the volunteers detect odours with the character of "ABP processing odour", they fill in an online form. Once the form has been submitted, online email alerts are automatically sent to a group of people such as the plant manager, the plant supervisor, the environment department, engineering, etc.
For this study, the actual incident records were compared with the incidents forecast by PrOlor. The data analysis period runs from August 2014 to June 2015.
For this study, two outcomes were considered correct: the system forecasts an odour impact and a complaint is received from one of the volunteers (odour match), and the system forecasts no odour impact and no incident is received (no-odour match).
Since the second outcome (no odour) is far more frequent than the first owing to the small number of incidents received, the no-odour hours were adjusted by excluding several time periods, such as plant shutdown hours, the volunteers' working hours (as they do not work in that town) and night-time sleeping hours. A total of 2,185 hours were analysed.
During the study, the spatial resolution of the WRF model was improved from 9 km to 3 km. The effect of this improvement on the performance of PrOlor was also studied.
3. Results and discussion
During the 10-month study period, 49 validated odour incident alerts were received in the register.
The next step was to determine which odour concentration level calculated by the model can be considered an incident. To this end, the optimum hit rate was calculated for different ambient odour levels forecast by the software. Figure 1 shows that the optimum level for considering that an episode forecast by PrOlor implies an odour impact is 2.1 ouE/m3.
Using the 2.1 ouE/m3 level, PrOlor forecast 73 incidents over the study period.
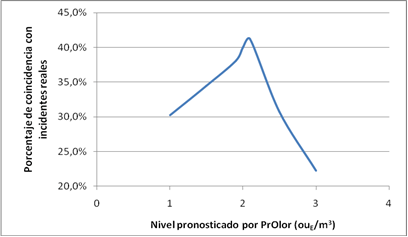 Figure 1: Odour forecast hit rates for different levels forecast by PrOlor.
For each complaint submitted by the volunteers, we checked whether PrOlor forecast the odour impact 1) at the exact hour, 2) within ±1 hour of the time of the incident, and 3) within 2 hours before or after the recorded time of the incident. The results are shown in the first column of Table 1.
Table 1: Agreement of PrOlor forecasts using different time windows relative to the time of the recorded incident.
|
Odour match |
No-odour match |
Odour + no-odour match |
|
|
Exact hour of incident |
23.5% |
97.7% |
96.6% |
|
±1 h of incident |
35.3% |
100% |
99.0% |
|
±2 h of incident |
41.2% |
100% |
99.1% |
The number of no-odour matches was also studied, i.e. forecasts of no-odour events compared with the times when no incidents were recorded, using the same time windows described above. The results are shown in the second column of Table 1.
Finally, the agreement of all forecasts was studied, i.e. PrOlor's forecasts of both odour and no-odour events, using the same time windows described above. The results are shown in the third column of Table 1.
The results show that PrOlor forecasts correctly in 96.6% of cases when both episodes with incidents and episodes without incidents are considered. This can be improved by using a ±2 h window around the time of the odour or no-odour event, which raises the percentage to 99.1%.
PrOlor forecasts correctly in 100% of cases when episodes without incidents are considered, using the optimum window of 1 or 2 hours before and after the time of the actual episode. However, PrOlor achieves a hit rate of only 41.2% when episodes with an incident are considered, using a ±2 h window.
Secondly, the effect on PrOlor's forecasts of improving the spatial resolution of the WRF model from 9 km to 3 km was examined, using the optimum window of ±2 h around the time of the odour incident. The results are shown in Table 2.
Table 2: Comparison of the PrOlor forecasting model with the incidents received (±2 h) at different stages of system improvement.
|
Odour match |
No-odour match |
Odour + no-odour match |
No. of incidents |
|
|
Initial PrOlor set-up |
41.2% |
100% |
99.1% |
37 |
|
After WRF resolution improvement |
12.5% |
100% |
98.6% |
12 |
The results show that the WRF resolution improvement reduced the hit rate for odour events and had no significant effect on the hit rate for no-odour events. In this respect, it should be noted that increasing the WRF resolution brought no improvement and even worsened PrOlor's forecasting rate, so this change will be removed from the software.
4. Conclusions
In August 2014, an ABP processing plant implemented the PrOlor system to forecast odour events in its surroundings. PrOlor is based on the Lagrangian model CALPUFF and, in this case, used the plant's odour emissions measured by dynamic olfactometry.
After 10 months, the results show that the optimum threshold for considering that an episode forecast by PrOlor implies an odour impact is 2.1 ouE/m3.
Furthermore, PrOlor forecasts correctly in 41.2%, 100% and 99.1% of cases for odour, no-odour and total events, respectively. These results are obtained with the optimum window of 2 hours before and 2 hours after the time of the actual episode.
Having examined the results, we conclude that increasing the resolution of the meteorological model does not improve PrOlor's forecasts.
5. Acknowledgements
We are grateful for the help and support given to this project by the staff of Render Grasas, S.L., especially Luís Cabotá Gimeno, Paqui Macías Polvillo and Raúl Díaz Aguilera. This work would also not have been possible without the efforts of the volunteers, particularly Pilar Sánchez Lianez and Maria José Pisonero Campos.
6. References
Carslaw, D.C. and Ropkins, K. 2012. Openair — an R package for air quality data analysis. Environmental Modelling & Software. 27-28, 52-61.
Cartelle Fernández David, Díaz Jiménez Carlos Nietzsche, Vellón Graña Jose Manuel, Rodríguez López Ángel. NOSE 2014, Venice. PrOlor, Forecast 2 Days Beforehand an Odour Incident.
Chang, C.-Y. and Chang L.Y. 2000. Effect of meteorology and air pollutant transport on ozone episodes at a subtropical coastal Asian city, Hong Kong. Journal of Geophysical Research Atmospheres, 105 (D16), 20707–20724.
Chang, J.C. and Hanna, S.R. 2004. Air quality model performance evaluation. Meteorology and Atmospheric Physics, 87, 167-196.
Díaz Jiménez, Carlos Nietzsche, 2009. El Apasionante Estudio de la Relación de Máximos al Promedio [The Fascinating Study of the Peak-to-Mean Ratio], Olores.org
Díaz Jiménez, Carlos Nietzsche, Cartelle Fernández David and Barclay Jennifer. 2014, olores.org International Seminar, Santiago de Chile. Revisión de Modelos de Dispersión Normativos, una Clave Importante en la Gestión de Olores en el Medio Ambiente [Review of Regulatory Dispersion Models, a Key Element in Environmental Odour Management].
Emery, C.A., Tai, E. and Yarwood, G. 2001. Enhanced Meteorological Modeling and Performance Evaluation for Two Texas Ozone Episodes. Prepared for the Texas Natural Resource Conservation Commission, by ENVIRON International Corp, Novato, CA.
Gonzalez, J.A., Hernandez-Garces, A., Rodriguez, A., Saavedra, S., Casares, J.J. 2014. A comparison of different WRF-CALMET simulations against surface and PBL rawinsonde data. 16th International Conference on Harmonisation within Atmospheric Dispersion Modelling for Regulatory Purposes. 8-11 September 2014, Varna, Bulgaria.
Gostelow, P., Parsons, S.A. and Stuetz, R.M. 2001. Wat. Res., 35 (3), 579-597.
NSW Environment Protection Authority (EPA), 2005, Approved Methods for the Modelling and Assessment of Air Pollutants in New South Wales
Scire, J.S., Robe, F.R., Fernau, M.E. and Yamartino, R.J. 2000a. A User’s Guide for the CALMET meteorological model. Earth Tech, Inc., Concord, MA 01742.
Scire, J.S., Strimaitis, D.G., M.E. and Yamartino, R.J. 2000b. A User’s Guide for the CALPUFF dispersion model. Earth Tech, Inc., Concord, MA 01742.
Skamarock, W. C. and Klemp, J.B. 2008. A time-split nonhydrostatic atmospheric model for weather research and forecasting applications. Journal of Computational Physics, 227(7), 3465-3485.
Smith, M. E. 1973. Recommended Guide for the Prediction of the Dispersion of Airborne Effluents. ASME, N.Y.
If you found this article interesting, you may also be interested in the following:
- PrOlor Forecasts Odour Incidents Two Days in Advance
- Review of Regulatory Dispersion Models, a Key Element in Environmental Odour Management
- Integrated Environmental Permits: Odour Emission Limits for Activities with a History of Odour Conflicts
- III International Conference on Odour Management in the Environment, 23-24 November 2015, Bilbao.
- The Official Conference Programme is now available
